
What's on this page
- What solar panel efficiency actually measures
- How panel efficiency is tested and rated
- What counts as good solar panel efficiency today
- Solar panel efficiency by type
- Efficiency vs wattage: which number matters
- How efficiency sets your panel count and roof space
- The roof space math, worked through
- Temperature: why hot panels lose efficiency
- Real-world conditions vs the lab rating
- Shade, soiling, and orientation losses
- Degradation: how efficiency ages over 25 years
- Cloudy days, winter sun, and low-light efficiency
- Does higher efficiency mean more savings?
- The price premium for high-efficiency panels
- When paying for high efficiency makes sense
- When standard efficiency is the smarter buy
- System efficiency: the losses beyond the panel
- Efficiency claims to be skeptical of in a sales pitch
- How to compare efficiency across quotes
- A worked example: two efficiencies, one roof
- Getting more from the panels you already own
- Where panel efficiency is headed
- The bottom line
Short answer: Solar panel efficiency is the percentage of sunlight energy a panel converts into electricity, measured under standard test conditions at 1,000 watts per square meter. Most new residential panels land around 20 to 23 percent. The number decides how much wattage fits on your roof, not whether a watt of solar works: two systems with the same total wattage produce essentially the same energy. Pay a premium for efficiency only when roof space is tight.
Solar panel efficiency is the percentage of sunlight energy a panel converts into electricity, and it is probably the most quoted, least understood number in a solar sales conversation. A 22% efficient panel is not “broken 78% of the time”; it turns 22% of the solar energy landing on its glass into usable power, which is genuinely good by the standards of the physics involved. The number matters, but it matters in a specific, practical way: it decides how much wattage fits on your roof, not whether a watt of solar works.
This teardown covers what the efficiency rating actually measures, how it is tested, what counts as a good number today, how the panel types compare, and the roof-space math that tells you whether paying a premium for high efficiency is smart or wasted. It also walks through what heat, shade, dirt, and age do to real-world output, because the gap between the lab rating and your roof is where most confusion lives. If you want the full sizing arithmetic behind these ideas, our solar sizing reference keeps every formula in one place, and the savings calculator turns your own bill into a system size in a few seconds.
Key takeaways
- Efficiency is the share of sunlight energy a panel converts to electricity; most new residential panels land around 20% to 23%.
- Two systems with the same total wattage produce essentially the same energy; higher efficiency just packs that wattage into less roof area.
- Heat, shallow sun angles, soiling, and wiring losses mean real output runs below the lab rating, which is why sizing math uses a derate factor.
- Panels degrade slowly, at a commonly cited rate of roughly 0.5% per year, so a modern panel still produces near 85% to 90% of its original output at year 25.
- Pay a premium for high efficiency when roof space is tight; on a big open roof, a cheaper mid-efficiency panel usually wins the value math.
What solar panel efficiency actually measures
A solar panel’s efficiency rating answers one question: of all the solar energy striking the panel’s surface, what fraction comes out the wires as electricity? Sunlight at full strength delivers a standardized 1,000 watts of energy per square meter. A panel rated at 22% efficiency converts 220 of those watts per square meter into electrical power; the rest reflects away, passes through, or turns into heat inside the cells.
That framing clears up the most common misreading. Efficiency is not a duty cycle, an uptime figure, or a measure of quality control. An 18% panel and a 23% panel are both working exactly as designed; the 23% panel simply extracts more electricity from the same patch of sunlight. Because the input, sunlight per square meter, is fixed by nature, efficiency is really a statement about power density: watts per unit of area. Double the efficiency and the same roof section yields double the wattage. That is the entire practical meaning of the number, and it is why everything in this teardown eventually comes back to roof space. A watt from a 19% panel and a watt from a 23% panel are identical once they leave the roof; the difference is how many square feet each watt needed.
How panel efficiency is tested and rated
Efficiency ratings come from a standardized lab measurement called standard test conditions, usually shortened to STC on a datasheet. The panel is exposed to light at 1,000 watts per square meter, with the cell temperature held at 25°C and the light spectrum fixed to approximate midday sun. Under those conditions, the panel’s measured power output divided by the light energy hitting its area gives the efficiency percentage.
The point of the standard is comparability, not realism. No roof holds a cell at 25°C in full sun; cells routinely run far hotter, and output drops as they do. But because every manufacturer tests against the same benchmark, you can put two datasheets side by side and trust the comparison. Datasheets often also list a second rating, commonly labeled NOCT or NMOT, taken at a more realistic operating temperature and lower light level; the output there is meaningfully lower, and it is a better hint of real-world behavior. When you compare panels, compare the same rating type across both, and treat STC as the panels’ shared measuring stick rather than a promise. The gap between the measuring stick and your roof is handled later in the sizing math, through the derate factor covered in our solar sizing reference.
What counts as good solar panel efficiency today
Mainstream residential panels installed today mostly rate between roughly 20% and 23%, and that band is a reasonable definition of “good.” Premium models using newer cell architectures sit at the top of the band and a bit beyond it, while budget equipment and older stock fall toward 18% to 20%. Ratings meaningfully below 18% on a new home quote are now unusual and worth questioning.
Context makes those numbers impressive rather than disappointing. A car engine turns something like a quarter to a third of its fuel’s energy into motion; converting more than a fifth of raw sunlight into electricity with a slab of glass and silicon that has no moving parts, lasts decades, and needs almost no maintenance is a strong deal. The commonly cited theoretical ceiling for a single-junction silicon cell is around 29%, so modern modules already capture a large share of what the physics allows. That is also why year-over-year improvements arrive as fractions of a percentage point: the easy gains are gone. The practical takeaway is that a couple of points of efficiency separates most of the market, and a couple of points rarely decides whether solar pays; it decides panel count and roof coverage, which the sections below quantify.
Solar panel efficiency by type
Efficiency clusters by cell technology, and knowing the clusters keeps a sales conversation grounded. The figures below are illustrative typical ranges for modules, not guarantees for any specific model.
Typical module efficiency by panel type
Illustrative ranges for modules sold today; individual models vary. Bars scaled to the top premium figure.
Monocrystalline dominates new residential installs, so most quote comparisons happen inside the 20% to 23% band rather than across types.
Monocrystalline panels, cut from single silicon crystals, are the residential standard and occupy the 20% to 23% band. Polycrystalline panels, made from melted silicon fragments, typically land around 15% to 17% and have mostly vanished from new home quotes as mono prices fell. Thin-film products commonly run around 10% to 13% and serve utility-scale farms and specialty uses like curved or portable surfaces more than rooftops. Our breakdown of the types of solar panels goes deep on how each is made and where each fits; for this teardown, the key point is that nearly every choice you will actually face lives inside the monocrystalline band, where the differences are a few points, not a doubling.
Efficiency vs wattage: which number matters
A datasheet leads with two numbers, efficiency and rated wattage, and buyers routinely fixate on the wrong one. Wattage is the panel’s power output under test conditions; efficiency is that output divided by the panel’s area. They are linked through size: a physically larger panel can post a big wattage at ordinary efficiency, and a compact panel can post a modest wattage at excellent efficiency.
For the energy your system produces, total system wattage is what matters. Ten kilowatts of panels produces essentially the same energy whether it is built from twenty-four higher-efficiency panels or twenty-eight mid-efficiency ones, because the sun does not care how the watts are packaged. Efficiency matters upstream of that: it determines whether ten kilowatts physically fits on your roof. So read the numbers in this order. First, how many kilowatts do you need, which comes from your usage and sun hours, math our solar sizing reference lays out. Second, does that wattage fit your usable roof area with the panel on offer? Only if the answer is no does efficiency become the headline number, because then a denser panel is how you make the target fit. A quote that leads with efficiency before establishing system size has the order backwards.
How efficiency sets your panel count and roof space
Here is the practical mechanism, in numbers you can check. Residential panels today are mostly a similar physical size, roughly 1.9 square meters of surface, which is about 20 square feet. At 1,000 watts of sunlight per square meter, that area receives about 1,900 watts of solar energy. Multiply by efficiency and you get the panel’s rating: at 22%, about 420 watts; at 17%, about 325 watts; at 12%, about 230 watts.
Now run a system through those densities. Suppose your usage calls for roughly 8.2 kilowatts of solar, a figure the savings calculator or the sizing reference can produce from your own bill. At 420 watts per panel you need 20 panels, occupying about 410 square feet of roof. At 325 watts you need 26 panels and roughly 530 square feet. At 230 watts you would need 36 or more panels and well over 700 square feet, which is why thin film does not appear on house roofs. Same energy produced in every case; wildly different footprints. This is the entire real-world consequence of the efficiency rating, and it is why the question “is my roof big enough?” is really the question “what efficiency do I need?”
The roof space math, worked through
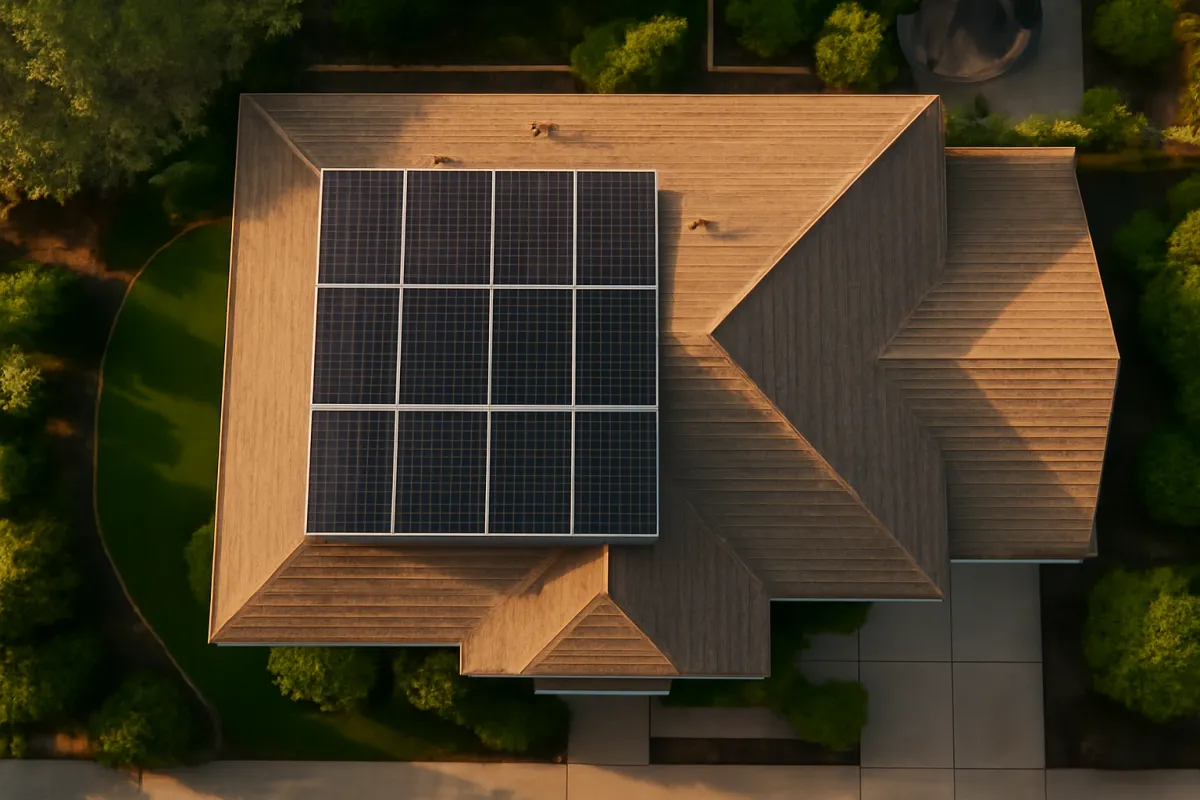
You can run the fit check yourself in three steps, no installer required. First, estimate your usable roof area: the south, east, and west-facing sections that are not shaded, not broken up by vents, skylights, or dormers, and large enough for full panels with the setback margins fire codes typically require at ridges and edges. A satellite view plus a tape measure on the ground gets you close; be conservative, because obstructions cost more space than they appear to.
Second, convert your target system size into panels. Divide the system wattage by the wattage of the panel you are considering and round up. An 8.2 kilowatt target with a 420 watt panel is 20 panels; with a 325 watt panel, 26.
Third, multiply the panel count by about 20 square feet and compare against your usable area. If the standard-efficiency version fits with room to spare, efficiency is not your constraint and price per watt should drive the decision. If it does not fit, you have three levers: a higher-efficiency panel, a smaller system that covers less of your usage, or accepting placement on a less ideal roof face. Each lever has a cost, and the right one depends on your rates and your roof. The interactive helper on this page runs all of this from your own numbers, and our walkthrough on how many solar panels you need treats the panel-count side in full.
Temperature: why hot panels lose efficiency
Solar cells convert light, not heat, and heat actively works against them. As cell temperature rises, the physics of the silicon junction shifts and output voltage falls, dragging power down with it. Datasheets quantify this as the temperature coefficient of power, typically somewhere around -0.3% to -0.4% of output per degree Celsius above the 25°C test temperature for modern mono panels.
The effect is larger than it sounds, because roof-mounted cells run hot. On a warm, sunny afternoon, cell temperatures can sit 20°C to 30°C above the test benchmark, which at a -0.35% coefficient trims roughly 7% to 10% off the rated output at the exact moment the sun is strongest. This is why systems often post their best single-day totals in cool spring weather rather than midsummer: long summer days win on hours, but crisp bright cool days win on instantaneous power. It is also a quiet reason the panel-type gap matters less than it looks, since premium cells often carry slightly better coefficients. When comparing datasheets, a coefficient of -0.30% versus -0.40% is a real difference in a hot climate, worth as much attention as a half point of headline efficiency. Mounting matters too: panels raised off the roof with airflow beneath them run cooler than flush-mounted ones.
Real-world conditions vs the lab rating
Stack up the real world against standard test conditions and you can account for essentially the whole gap between the nameplate and your meter. The lab assumes light arriving at full strength, straight on, with the cell at 25°C. Your roof gets shallow-angle morning and evening light, seasonal sun heights, cell temperatures far above the benchmark in summer, and an atmosphere that varies with humidity and haze.
Sizing math handles this honestly with two tools. Peak sun hours compress a day’s varying light into the equivalent hours of full-strength sun, typically around 3.5 to 6 depending on region. The derate factor, commonly around 0.8, then absorbs the remaining system losses: temperature, wiring, inverter conversion, soiling, and mismatch between panels. A 420 watt panel at 4.5 peak sun hours and a 0.8 derate produces about 1.5 kilowatt-hours per day on average, not the 1.9 the nameplate might tempt you to expect. None of this means the efficiency rating lies; it means the rating is a standardized input to a calculation, not the calculation’s answer. If your system delivers around 75% to 85% of naive nameplate expectations across a year, it is performing normally, and our walkthrough on monitoring solar production shows how to verify that against a proper baseline.
Shade, soiling, and orientation losses
Three site-specific factors move real efficiency more than any datasheet line, and all three are at least partly in your control. Shade is the heavyweight. Because cells within a panel are wired in series, shading a small slice of a panel can pull down the whole panel’s output disproportionately, and on older string-inverter systems it could drag neighboring panels too. Modern systems mitigate this with panel-level electronics, but mitigation is not immunity: a chimney shadow crossing the array for two hours daily still costs real production. Trim what can be trimmed and design around what cannot.
Soiling is the slow leak. Dust, pollen, ash, and bird droppings build a film that scatters light before it reaches the cells, commonly costing a few percent and more in dry, dusty regions or under trees. Rain handles most of it in most climates; where it does not, an occasional rinse recovers the loss, and our walkthrough on cleaning solar panels covers doing it safely.
Orientation is fixed at install time and worth getting right. In the northern hemisphere, south-facing panels at a tilt near your latitude capture the most annual energy; east and west faces commonly give up around 10% to 20% of annual production but shift generation toward morning or evening, which can be worth real money under time-of-use rates. Orientation is not an efficiency loss in the datasheet sense, but it changes delivered energy just the same.
Degradation: how efficiency ages over 25 years
Panels lose a little capability every year, and the honest news is how little. Modern equipment carries a commonly cited degradation rate of roughly 0.5% of output per year, often with a slightly larger one-time dip in the first year as the cells settle under initial light exposure. Compounded over a quarter century, that leaves a panel producing somewhere near 85% to 90% of its day-one output at year 25, which is why manufacturer performance warranties typically guarantee a floor in that territory.
For planning, treat degradation as a known input rather than a risk. If your system produces about 10,800 kilowatt-hours in year one, expect something closer to the low 9,000s in year 25, and size accordingly if you want full coverage late in life. Degradation also interacts with the buy decision: a premium panel with a slightly lower degradation rate delivers a compounding edge that can matter more over 25 years than a half point of day-one efficiency. Watch for the failure modes that are not normal aging, such as a sudden step down in output, hot spots, or visible browning, which are warranty conversations rather than expected wear. Our coverage of how long solar panels last works through lifespan, warranties, and end-of-life in full.
Cloudy days, winter sun, and low-light efficiency
Efficiency ratings are measured at full-strength light, so a fair question is what happens when the light is weak. The answer is that panels keep converting at nearly their rated efficiency; there is simply less energy arriving to convert. Under heavy overcast, the light reaching your roof might be 10% to 25% of full sun, and output falls roughly in proportion. The panel is not underperforming; the input shrank.
Two secondary effects nudge the picture. Cool cloudy weather helps, because cold cells run above their hot-day output for whatever light they do receive. And diffuse light, scattered by clouds, arrives from the whole sky rather than one direction, which slightly softens the penalty for imperfect orientation. Winter combines short days, a low sun angle, and occasional snow cover, so seasonal production dips have more to do with astronomy than with any change in the panel itself; the efficiency rating is the same in January as in July. If you are weighing solar in a gray or northern climate, the question is annual sun hours, not panel capability, and our explainers on solar panels on cloudy days and solar in winter put illustrative numbers on both.
Does higher efficiency mean more savings?
Mostly no, and the reason is worth internalizing before a sales meeting. Your savings come from the kilowatt-hours your system produces and what each one offsets on your bill. Production is set by total system wattage, sun hours, and losses; the efficiency of the individual panels does not appear in that formula except through the wattage it enabled. An 8.2 kilowatt system built from 21% panels and an 8.2 kilowatt system built from 23% panels produce, for practical purposes, the same energy and the same savings.
Where efficiency does touch savings is indirect. If low efficiency prevents you from fitting the system size your usage calls for, the smaller system covers less of your bill and leaves savings on the table; in that case higher efficiency unlocks real money. Slightly better temperature coefficients and degradation rates on premium panels add small compounding gains. And under tight roof constraints, denser panels may let you keep the whole array on the best-facing roof section instead of spilling onto a worse one. But if two quotes deliver the same system size on your roof, the one with the lower cost per watt wins regardless of which panel has the shinier efficiency number. Run both through the savings calculator and let payback, not the datasheet, pick the winner. Our payback coverage note shows how the break-even math weighs cost against production.
The price premium for high-efficiency panels
Premium efficiency costs money, and the structure of the premium matters. Panel pricing is usually discussed per watt, and high-efficiency premium models commonly run some tens of cents per watt above standard mono equipment, an illustrative gap of perhaps 10% to 25% at the panel level. Because panels are only one slice of an installed system’s cost, alongside labor, racking, inverters, permits, and overhead, the premium dilutes at the system level, but on a multi-kilowatt array it still amounts to an illustrative four figures.
What do you get for it? A few points of efficiency, often a better temperature coefficient, sometimes a lower degradation rate and a longer or stronger warranty, and frequently a cleaner all-black look. What you do not get is more energy per watt installed; a watt is a watt. So the premium is really buying density and durability margins. Whether that is worth an illustrative $1,000 to $2,000 on a typical home system depends entirely on whether density solves a problem you actually have. The next two sections split that decision cleanly. When you compare quotes, normalize everything to cost per watt and check the fine print on the warranty, a habit our walkthrough on reading a solar quote builds step by step.
When paying for high efficiency makes sense
High-efficiency panels earn their premium in a handful of specific situations, and it is worth checking honestly whether yours is one of them. The clearest case is a constrained roof: limited south-facing area, dormers and vents chopping the planes into small sections, or setback rules eating the margins. If standard panels cannot fit the system size your usage requires, paying more per watt to hit the target usually beats living with an undersized array, because the shortfall would cost you savings every year for decades.
A second case is high usage on a normal roof: households with electric heat, an EV or two, or a pool can need systems large enough that even a generous roof runs out of room. Third, partial-shade sites benefit from premium panels’ typically better low-light behavior and tighter tolerances, though shade mitigation electronics matter more. Fourth, if you plan to add load later, an EV, a heat pump, a battery, installing denser panels now preserves roof area for a future expansion. And finally, some buyers simply value the all-black aesthetic and the longer warranty on premium lines enough to pay for them; that is a legitimate preference, as long as it is priced consciously. In all these cases, get the premium quantified per watt and check it against the alternative of more standard panels.
When standard efficiency is the smarter buy
For most homes with reasonably sized, reasonably unshaded roofs, standard-efficiency mono panels around 20% to 22% are the value play, and the arithmetic is straightforward. If your roof fits the target system size with standard equipment, the premium panel’s density buys you nothing you need. The same budget stretched across cheaper panels either lowers your cost, and shortens payback, or funds a slightly larger system that produces more energy than the premium alternative at the same spend.
An illustrative comparison makes it concrete. Suppose an 8.2 kilowatt system needs 20 standard panels that fit comfortably on your south roof. A premium quote at an extra $0.30 per illustrative watt adds roughly $2,500 before incentives for the same 8.2 kilowatts. That money could instead buy most of an additional kilowatt of standard capacity, real additional production, if you wanted it, or simply stay in your pocket and pull payback in by months to a year. Standard-tier equipment from established manufacturers still carries multi-decade performance warranties and the same basic physics. The exception to check is the long game: if a future EV or heat pump is likely, weigh whether filling the roof with mid-density panels now forecloses an expansion you will want later. Otherwise, boring panels and a better price is the quietly correct answer more often than the sales floor suggests.
System efficiency: the losses beyond the panel
Panel efficiency gets the headlines, but your system has an efficiency of its own, and it is the one your bill actually feels. Between the cells and your outlets, energy passes through wiring, connectors, an inverter that converts DC to AC, and sometimes a battery round trip, and every stage takes a cut. Inverter conversion commonly runs in the mid-to-high 90s percent; wiring and connection losses trim a bit more; panel-to-panel mismatch and soiling shave their own slices.
The sizing convention that absorbs all of this is the derate factor, commonly around 0.8, meaning you plan on about 80% of nameplate production reaching your meter as usable energy. That single number quietly outweighs most panel-level distinctions: moving your derate from 0.80 to 0.75 through poor wiring or a shaded design costs more energy than the gap between a 21% and a 22% panel. It is also why quote comparisons should reach past the panel spec to the whole design: inverter type and sizing, string layout, wire runs, and expected losses. Two quotes with identical panels can deliver noticeably different energy, and the difference lives here. The formulas in our solar sizing reference show exactly where the derate enters the math, and the interactive helper on this page lets you feel its effect by switching between conservative and optimistic values.
Efficiency claims to be skeptical of in a sales pitch
Efficiency is the number sales pitches lean on hardest, so it collects the most spin. A few patterns deserve automatic skepticism. “Most efficient panel on the market” is usually either outdated or true only within a narrow slice of models; the top of the market is crowded within a point, and the crown changes hands routinely. Cell efficiency quoted in place of module efficiency inflates the number, since a bare cell always tests higher than the assembled panel with its frame, gaps, and glass; make sure you are comparing module ratings.
Percentages without context are another tell. “Twenty-five percent more efficient” can mean five points of absolute efficiency or a 22% panel being compared to a 17.5% one that nobody quotes anymore; ask for both datasheets. Claims that high-efficiency panels “work in the dark” or “eliminate the need for a battery” are physics-free. And any pitch that uses efficiency to justify a dramatically higher price without showing the roof-space constraint that would make density valuable is selling the number, not the outcome. The defense is the habit this teardown keeps repeating: normalize quotes to total system size and cost per watt, verify the module datasheet, and make efficiency prove it solves a real constraint on your actual roof. Our walkthrough on choosing a solar installer covers the broader vetting.
How to compare efficiency across quotes
When quotes are in hand, a short checklist turns the efficiency line from marketing into information. First, pull the actual module model number from each quote and find its datasheet; confirm the module efficiency, rated wattage, temperature coefficient, degradation schedule, and warranty terms from the sheet rather than the proposal’s summary. Second, confirm both quotes deliver the system size your usage calls for; if they differ in kilowatts, they are not comparable until you normalize.
Third, divide each quote’s total price by its total wattage to get cost per watt, the great equalizer. A premium-panel quote at a higher cost per watt has to justify the gap with something you need: fit on a tight roof, materially better coefficients, a stronger warranty. Fourth, check the physical layout drawing: how many panels, on which roof faces, with what expected shade. A quote achieving its size by spilling panels onto a north-facing plane is buying wattage that will underdeliver. Fifth, ask each installer for their assumed production estimate in kilowatt-hours per year and compare it to your own math from the sizing reference; an estimate that outruns your usage, sun hours, and a sane derate deserves an explanation. Ten minutes of this converts the efficiency conversation from adjectives to arithmetic.
A worked example: two efficiencies, one roof
Put the whole teardown into one household. A family uses about 10,800 kilowatt-hours a year, average sun of 4.5 peak hours, and a 0.8 derate; the sizing formula calls for roughly 8.2 kilowatts of solar. Their usable south-facing roof measures about 480 square feet after setbacks and obstructions.
Option one is a standard 22% mono panel: about 420 watts in 20 square feet. The 8.2 kilowatt target needs 20 panels and about 410 square feet. It fits with margin, produces roughly 29 to 30 kilowatt-hours on an average day, and about 10,800 a year, matching usage. Option two is a 17% panel at about 325 watts in the same footprint: 26 panels and roughly 530 square feet, which does not fit the 480 available. The family would have to drop to 23 panels, about 7.5 kilowatts, and cover only about 91% of usage, giving up the difference in savings every year.
Here, standard-tier 22% equipment is not a luxury; it is what makes full coverage fit, while a premium 23% panel would add cost without adding anything the roof needs. Flip the roof to 700 open square feet and the calculus flips too: the 17% panel, if priced meaningfully lower per watt, would deliver identical energy for less money. The roof, not the datasheet, decided both times. Run your own version with the helper on this page or the savings calculator.
Getting more from the panels you already own
If you already own a system, you cannot change its panels’ efficiency, but you can defend the efficiency of everything around them, and the recoverable margin is real. Start with soiling: a layer of dust or pollen commonly costs a few percent, and a safe rinse recovers it; our walkthrough on cleaning solar panels covers when it is worth doing versus letting rain handle it. Watch for new shade, because trees grow; a branch that has crept over the array’s morning sun since install is a quiet, compounding loss.
Where the sun's energy goes on a modern panel
Illustrative split for a roughly 22% efficient module under full sun. Shares sum to 100%.
Most incoming energy becomes heat because silicon can only convert part of the light spectrum. Owner-controllable losses, shade, soiling, and system faults, sit on top of this physics and are the part worth defending.
Then monitor. A production baseline built from your system size and local sun hours tells you within a week when output slips below normal, which is how inverter faults, failed optimizers, or a downed string get caught early instead of after a season of losses; our walkthrough on monitoring solar production sets that baseline up. Finally, keep the inverter healthy, since it is the component most likely to need replacement mid-life and every point of its conversion efficiency is a point of yours.
Where panel efficiency is headed
The honest forecast is steady, incremental gains rather than a breakthrough on your roof. Mainstream residential modules have climbed a few percentage points over the past decade as the industry moved through better cell architectures, and current premium designs continue that grind toward the mid-20s. The commonly cited ceiling for single-junction silicon sits near 29%, so the remaining headroom for the technology that actually ships to homes is measured in single digits.
The genuinely exciting work, stacked tandem cells that pair silicon with other materials to harvest more of the spectrum, has posted laboratory results well beyond silicon’s limit. Durability and manufacturing cost at scale remain the hurdles between the lab and a rooftop, and timelines for that transition are uncertain enough that no purchase decision should wait on it. The practical implication cuts against waiting in general: a point or two of future efficiency does not change the roof-space math for most homes, while every year of waiting forfeits a year of savings under whatever rates and incentive rules you have now. Panels you install today carry warranties into the 2050s; the ones you might buy in five years will be marginally denser, not categorically different. If solar pencils out on your roof today, the physics pipeline is not a reason to delay, a point our walkthrough on going solar makes about timing generally.
The bottom line
Solar panel efficiency is the share of sunlight a panel converts to electricity, and for equipment quoted on homes today that means roughly 20% to 23%. The number’s real-world job is narrower than its billing: it sets power density, how many watts fit in each square foot of roof, and almost nothing else about your outcome. Total system size drives production; sun hours and the derate drive what production becomes energy; rates and net-metering rules drive what energy becomes money. Efficiency only decides whether the system you need physically fits.
So let the roof make the call. Tight, complicated, or shaded roofs justify premium density; big open roofs reward the cheapest reliable watt. Compare module datasheets rather than proposal adjectives, normalize quotes to cost per watt at equal system size, respect the temperature coefficient in hot climates, and plan around a half percent a year of aging. Then check the fit with your own numbers: the helper on this page turns your usage, sun band, and panel choice into panel count and roof area, and the savings calculator turns your bill into the system size that starts the whole calculation.
This teardown is educational material, not engineering, purchasing, or financial advice, and none of it substitutes for a site assessment of your actual roof. The efficiency percentages, panel wattages, square footages, price premiums, and production figures above are illustrative teaching examples, not specifications or quotes; real modules, roofs, climates, and prices vary widely and change over time. Panel datasheets, warranty documents, and written installer proposals for your specific address are the numbers that count. Confirm structural, electrical, and fire-setback questions with licensed professionals, and let a qualified installer’s measured design, not these worked sketches, determine what goes on your roof.
Frequently asked questions
What is solar panel efficiency in simple terms?
Solar panel efficiency is the percentage of the sunlight energy hitting a panel that gets converted into usable electricity. A panel rated at 22% efficiency turns 22% of the solar energy striking its surface into power and loses the rest, mostly as heat and reflection. The rating is measured under standardized lab conditions so different panels can be compared fairly. Higher efficiency means more watts from the same physical area, which matters most when roof space is limited. It does not mean the panel works only 22% of the time; it describes energy conversion, not uptime.
What is a good solar panel efficiency in 2026?
Most residential panels installed today fall in a range of roughly 20% to 23%, with premium models pushing a little higher. Anything around 21% to 22% is solidly mainstream, and ratings below about 18% are now mostly limited to older stock or thin-film products. The commonly cited practical ceiling for the silicon cell designs that dominate home installs sits in the mid-to-high 20s, so the gap between a standard and a premium panel is a few percentage points, not a chasm. Because of that, an efficiency rating a point or two lower rarely changes whether solar makes sense; it mainly changes how many panels the job takes.
Which type of solar panel is most efficient?
Monocrystalline panels lead the residential market, with typical module ratings around 20% to 23% and premium cell designs at the top of that band. Polycrystalline panels usually land around 15% to 17%, which is why they have largely disappeared from new home quotes. Thin-film panels commonly run around 10% to 13% and are mostly used in utility-scale or specialty applications rather than on houses. All of these are illustrative ranges rather than guarantees for a specific model, so check the datasheet of the exact panel on your quote. Our breakdown of the types of solar panels walks through the differences in detail.
Does solar panel efficiency really matter?
It matters, but usually less than sales pitches suggest, and mainly through roof space. Two systems with the same total wattage produce essentially the same energy regardless of the panel efficiency behind that wattage; the higher-efficiency version just fits the wattage into fewer square feet. If your roof is large and unshaded, a mid-efficiency panel at a lower price often wins the value math. If your usable roof area is tight, shaded at the edges, or broken up by vents and dormers, higher efficiency can be the difference between covering your usage and falling short. Focus first on total system size in kilowatts, then use efficiency to judge whether that size fits your roof.
Do solar panels lose efficiency over time?
Yes, slowly and predictably. Panels degrade as materials age under sun and weather, with a commonly cited rate of roughly 0.5% of output per year for modern equipment. At that pace a panel still produces somewhere near 85% to 90% of its original output after 25 years, which is why performance warranties typically guarantee a floor in that neighborhood. The first year often shows a slightly larger one-time dip from initial light exposure before settling into the slow annual decline. Degradation is a scheduling fact to plan around, not a defect, and our coverage of how long solar panels last works through what it does to lifetime production.
Why is my solar panel's real output lower than its rated efficiency?
The efficiency rating is measured under standardized test conditions: a fixed light intensity, a 25°C cell temperature, and a perfect angle. Real roofs rarely match that, so real output runs below the lab number even when nothing is wrong. Heat is the biggest routine factor, since cells lose a fraction of a percent of output for every degree they run above the test temperature, and a panel in summer sun runs well above it. Add morning and evening sun arriving at shallow angles, dust or pollen on the glass, wiring and inverter losses, and occasional shade, and a system delivering around 75% to 85% of its theoretical output is behaving normally. That gap is exactly why sizing math applies a derate factor rather than trusting the nameplate.
Are high-efficiency solar panels worth the extra cost?
It depends almost entirely on whether roof space is your binding constraint. Premium panels commonly carry a price premium per watt over standard equipment, and if your roof can fit the system size you need using standard panels, that premium buys you mostly aesthetics and a nicer datasheet. Where premium efficiency earns its keep is a small or complicated roof: if standard panels cannot fit enough wattage to cover your usage, paying more per watt to hit the target beats installing an undersized system. Run the roof-space math before paying up, and treat any figures here as illustrative rather than a quote for your home.
Can solar panels reach 100% efficiency?
No, and physics is the reason rather than manufacturing quality. Sunlight arrives across a wide spectrum of wavelengths, and a silicon cell can only convert a portion of that spectrum; some light passes through, some reflects, and much of the energy becomes heat. The commonly cited theoretical ceiling for a single-junction silicon cell is around 29%, and commercial modules give up several more points to gaps, wiring, and glass. Laboratory cells using stacked, multi-junction designs have gone well beyond silicon's limit, but those remain expensive and are not what gets installed on homes. Practical progress shows up as slow, steady gains of fractions of a percentage point per year, not leaps.